AI Workloads Are Network Workloads
Agentic AI will not scale on models alone. It needs bandwidth, telemetry, path visibility, and security context across every dependency.

This is the practical point behind the Cisco and Foundry research: the network is no longer background plumbing. It is the place where agentic AI demand, performance, policy, visibility, and trust collide.
The Shift: AI Is Becoming a Network Event
The first AI conversations were about models. The next operating challenge is where those models run, what they touch, and whether the infrastructure can keep up.
When an AI workflow runs, the model is only one piece of the system. A prompt may trigger tool calls, retrieve data, query logs, open tickets, reach SaaS applications, call APIs, inspect telemetry, and return an answer to a user or another agent. Every one of those steps depends on infrastructure.
That is why AI workloads are network workloads. They create new traffic patterns, new dependency paths, new security boundaries, and new questions about performance. A slow answer might be a model runtime issue. It might be memory pressure. It might also be a bandwidth bottleneck at one network hop. The team cannot know unless workload and path signals are visible together.
The Pressure: The Network Is Already Feeling AI
Cisco and Foundry's research is a warning that AI ambition is moving faster than campus and branch readiness.
Cisco's Newsroom coverage of the Cisco and Foundry study says the research surveyed more than 3,400 senior IT and networking decision-makers across 15 countries. The headline is not subtle: organizations want AI, but the infrastructure path to scale is under pressure.
Capacity constraints now or within two years
Expected traffic growth over three years
AI has expanded the attack surface
Growing monitoring and visibility blind spots
Holding back AI scale until security confidence improves
For IT leaders, this reframes the AI roadmap. It is not enough to ask which model or AI tool the business wants to use. The harder question is whether the network can support the demand, whether security can govern the access, and whether operations can prove what is happening when the experience changes.
The Lab: A Small Version of a Big Operating Problem
My local setup is intentionally small, but the questions are the same ones that show up at enterprise scale.
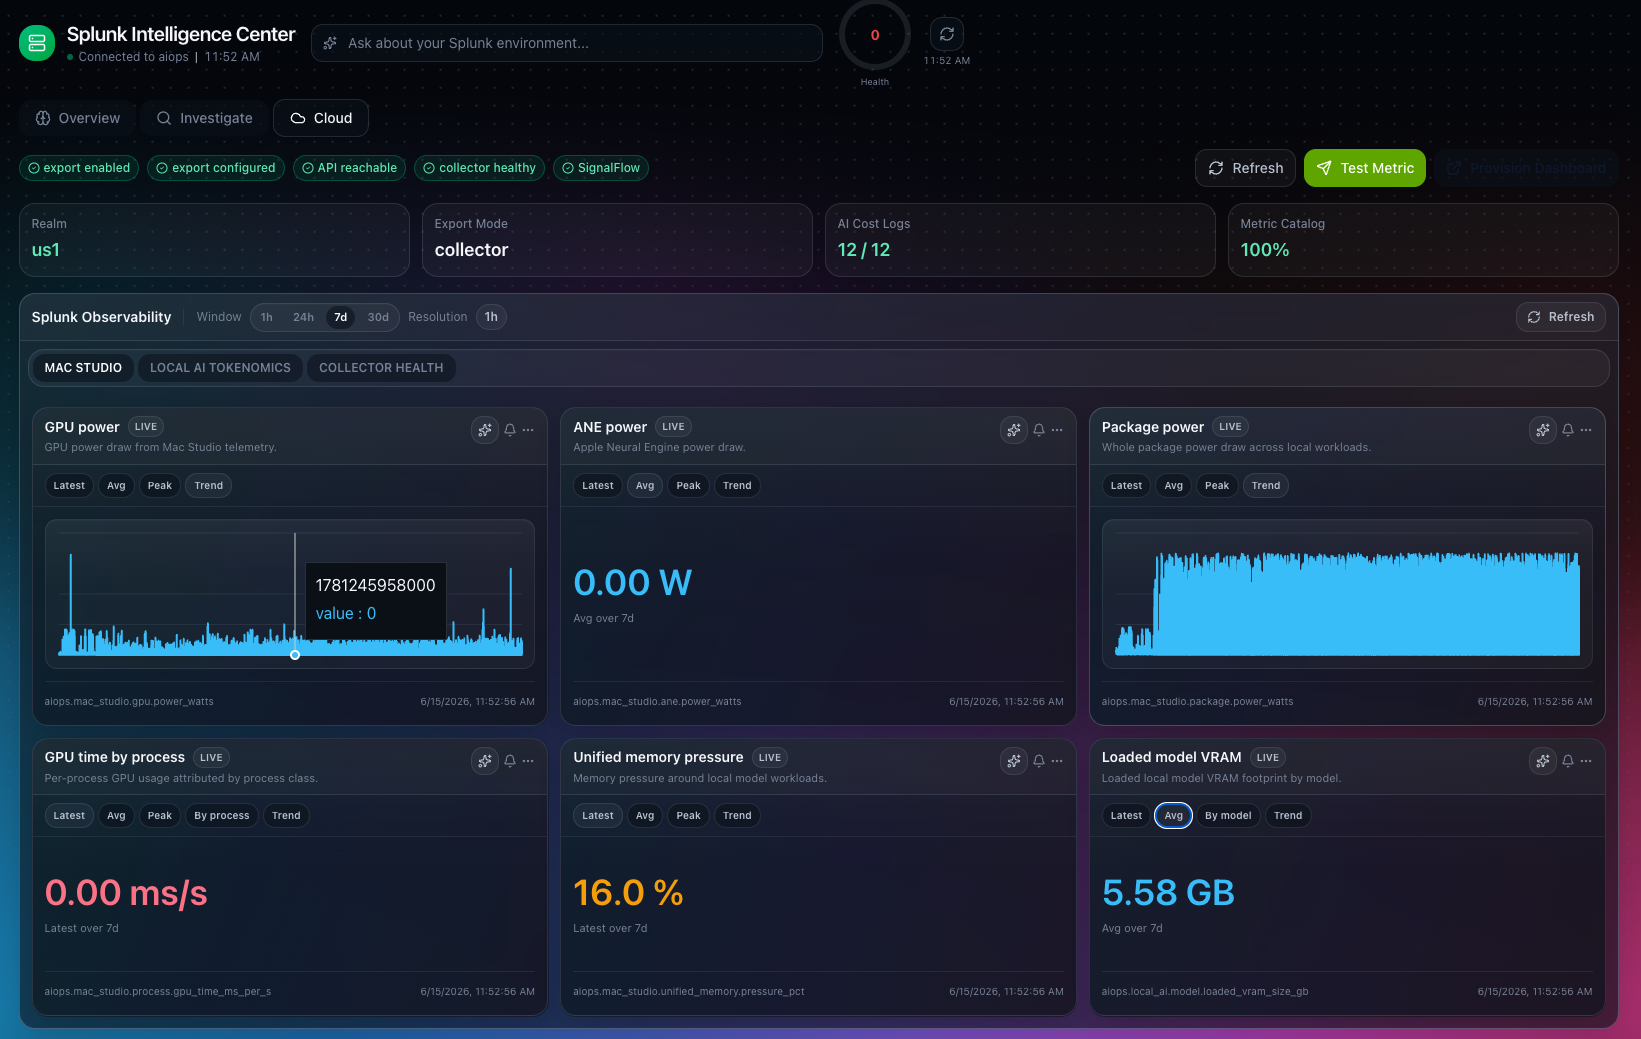
I run local AI models on a Mac Studio and monitor the environment as if it were a miniature production workload. The point is not that every organization needs this exact lab. The point is that AI creates measurable demand, and that demand needs to be understood before it spreads across real users, branches, agents, and business workflows.
Generate real inference behavior instead of treating AI as an abstract architecture slide.
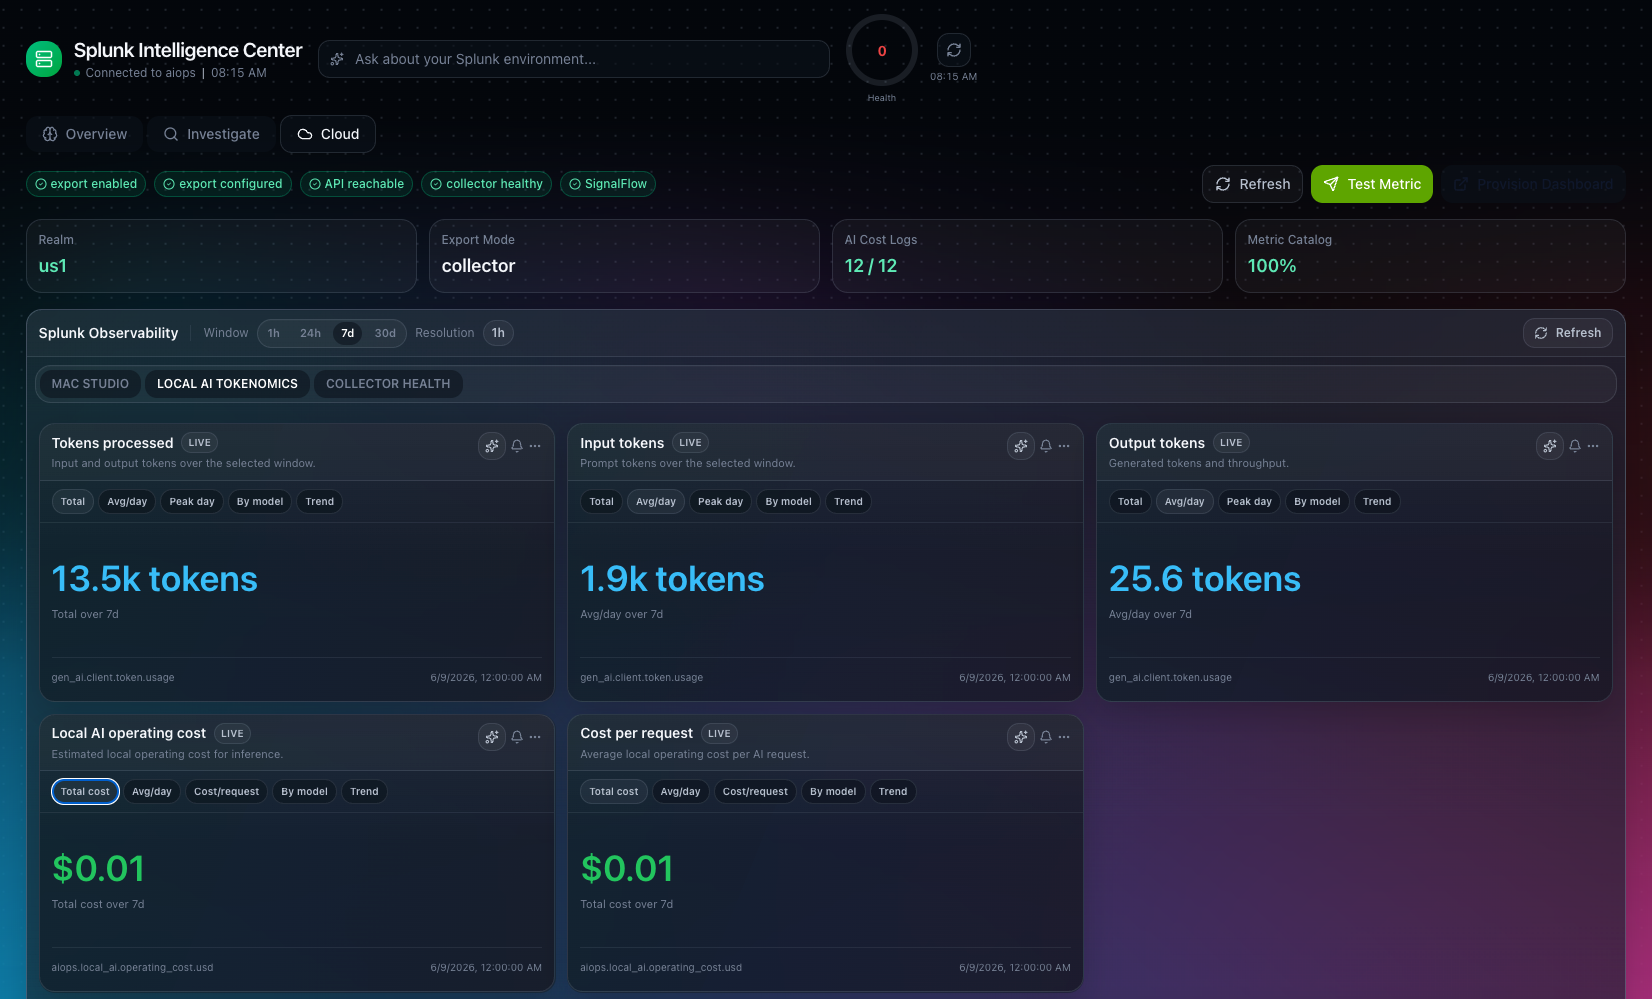
Track model-side and host-side signals: resources, memory, tokens, footprint, and cost.
Validate the routes and network conditions the AI workload depends on.
Improve the host, runtime, path, access model, or network before users feel the bottleneck.
That combination matters because AI performance is easy to misdiagnose. If a response feels slow, the model might not be the issue. The problem could be memory pressure, path loss, DNS, an upstream endpoint, a provider handoff, or a tool call that crosses the wrong boundary.
Splunk Evidence: Make the Workload Measurable
Observability turns AI from a black box into a set of operating signals IT can discuss, tune, and defend.
For my local AI setup, Splunk Observability helps tie the model experience back to infrastructure signals. I want to know whether GPU, ANE, package power, memory pressure, model footprint, process activity, token volume, and local operating cost are moving the way I expect.
ThousandEyes Evidence: Make the Path Visible
Agentic AI reaches across tools, APIs, data sources, clouds, and branches. That means path evidence becomes AI evidence.
ThousandEyes helps me look at the network side of the same workload. If an AI workflow reaches an endpoint, calls a service, or depends on a remote tool, the answer may not live in the model runtime. It may live in available bandwidth, a route, one overloaded hop, an ISP handoff, packet loss, DNS, or a target that is reachable but degraded.
Consider an internal AI assistant used from the office. Employees may report slow answers even while the model and server are healthy. If Access switch X is oversubscribed—or its uplink has too little available throughput—the request can queue at that hop, adding delay to every retrieval and tool call that crosses it. To the employee, “AI is slow.” To the network team, one dependency is capacity-constrained.
- 01 · Request Office user Prompt leaves the device
- 02 · Bottleneck Access switch X Uplink near capacity Throughput constrained
- 03 · Transit Campus core Path remains healthy
- 04 · Service Internal AI Model responds normally
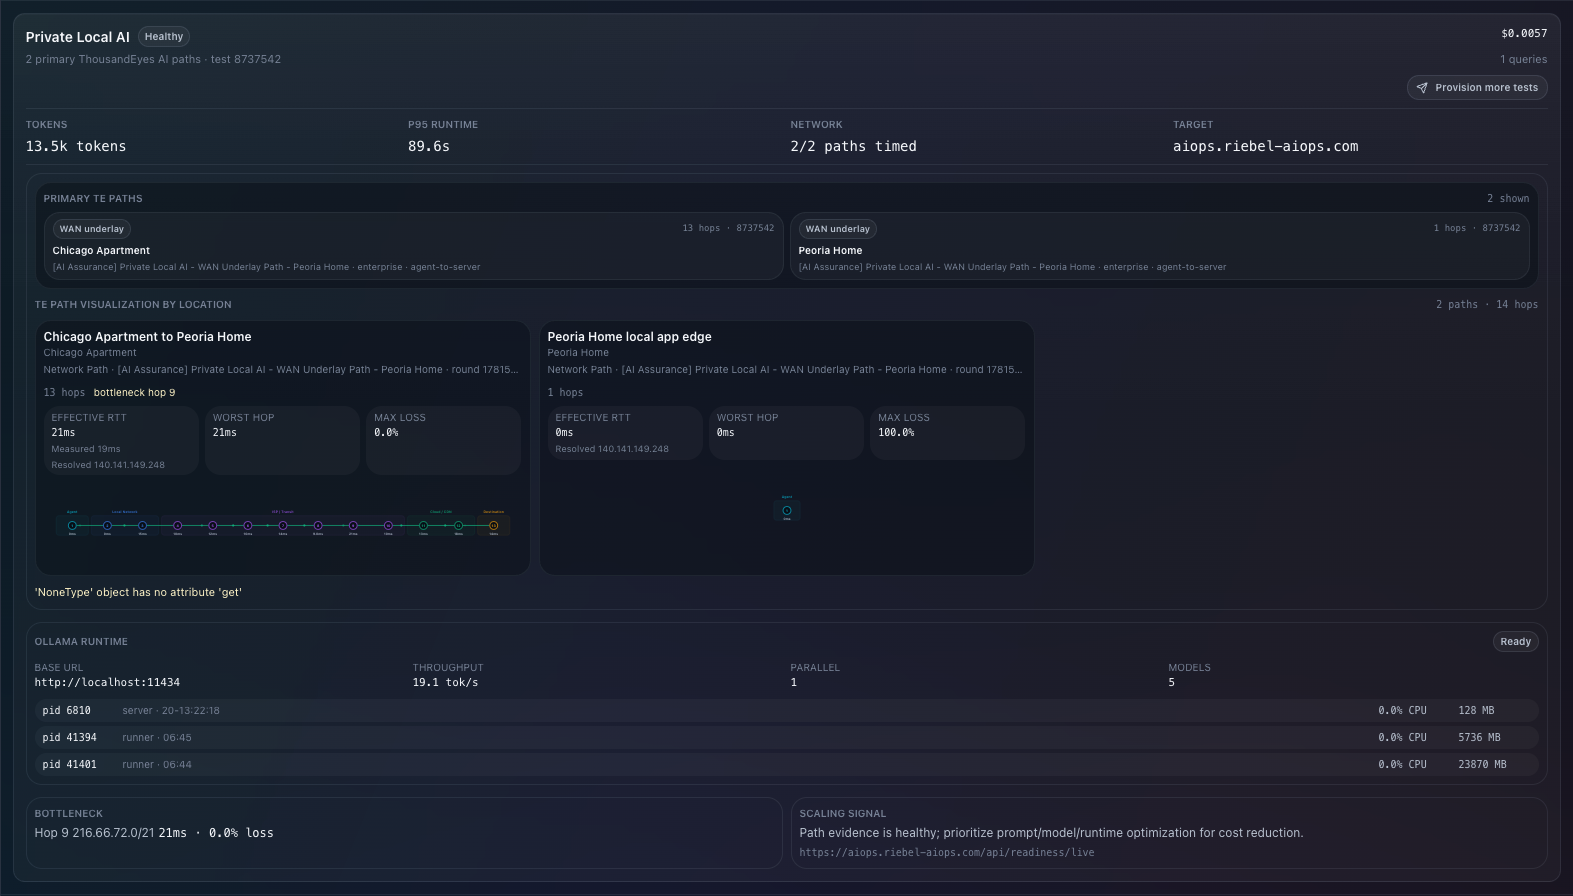
That is the operating advantage. ThousandEyes can help show where the path changes from healthy to degraded, while switch telemetry confirms whether the cause is an overloaded uplink. Visibility does not create more bandwidth, but it points the team to the right action: rebalance or reroute traffic where an alternate path exists, apply QoS, move the workload closer to users, or add capacity at the constrained access layer.
The Operating Model: Correlate Before You Scale
AI readiness is not one dashboard. It is the ability to connect workload, path, policy, and outcome.
Tokens, runtime, memory, model footprint, host pressure, and cost.
Routes, hops, loss, latency, DNS, reachability, provider behavior, and endpoint health.
Identity, access, segmentation, approved tools, sensitive data, logging, and change control.
User experience, adoption, reliability, owner, risk, and next action.
This is where Cisco's platform strategy becomes relevant. The value of Cisco Cloud Control is not just that it brings domains into one view. The important direction is a governed operating layer where humans and trusted AI agents can work from shared context across networking, security, observability, collaboration, and infrastructure.
For IT leaders, the takeaway is straightforward: before AI becomes another sprawling set of tools, build the operating model that lets the team see what AI is doing, where it is going, what it is allowed to touch, and what needs to change next.
What IT Leaders Should Do Next
The best time to prepare the network for AI is before the business depends on the workload.
Capture runtime, token, resource, cost, path, and policy signals for the AI workflows that matter.
Know normal traffic, available bandwidth, uplink utilization, latency, memory, token volume, endpoint behavior, and user experience before rollout pressure hits.
Identify which apps, APIs, users, agents, branches, clouds, and data sources each workload depends on.
Apply identity, segmentation, access policy, logging, and governance where the work actually happens.
Relieve constrained hops, modernize the network or runtime, and scale capacity based on evidence instead of reacting to complaints.
Keep measuring as models, agents, traffic paths, and business usage change.
The organizations that scale AI well will not treat the network as background plumbing. They will treat it as part of the AI platform: observable, secure, governed, and ready to adapt as workloads change.
Source Trail View the References Behind This Brief Cisco, Splunk, and ThousandEyes sources are used for product and research context. The lab screenshots are my own local environment.
Cisco / Foundry AI Network Research
Used for the campus and branch AI research statistics, including survey size, capacity constraints, traffic growth, security concerns, visibility blind spots, and readiness gaps.
Splunk Observability for AI
Used for Splunk Observability for AI context around AI application monitoring, infrastructure health, token usage, estimated cost, and agentic application observability.
ThousandEyes Network Assurance
Used for ThousandEyes context around network and application synthetics, traffic insights, WAN insights, path evidence, packet loss, latency, and bottleneck visibility.
Cisco Cloud Control
Used only for broader platform context: humans, AI agents, telemetry, policy, governance, and action coming together in one operating layer.
Local Lab Screenshots
Used as a practical example of local AI instrumentation, including Mac Studio resource telemetry, local AI tokenomics, and path visibility for an AI workload.
React or leave a comment.
Public reactions and comments help keep the conversation attached to the brief.